
Test results
Skylight shading test results
How does shading affect temperatures around a skylight? Explore an on-site comparison in Hall M13 in Mladá Boleslav and a separate summer test with temperature sensors. Each section gives the measured values, the method and the conditions that apply to the results.
01
On-site comparison of shading in Hall M13 in Mladá Boleslav
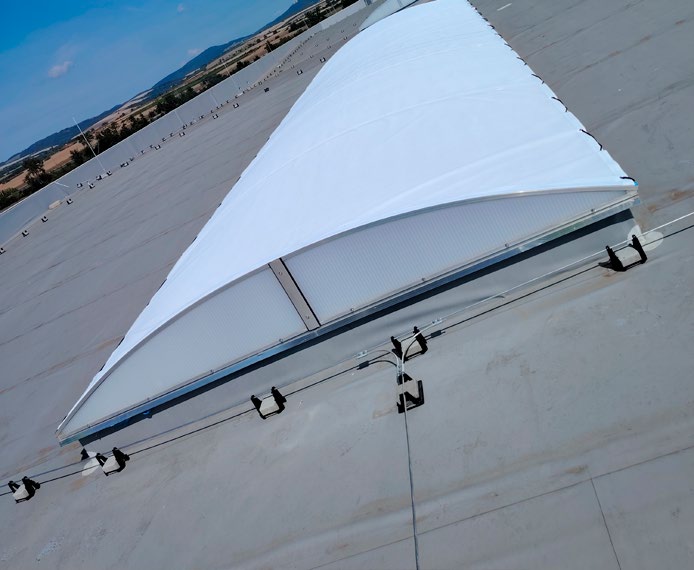
Five measures to reduce overheating were compared in Hall M13 in Mladá Boleslav. After a roof skylight was shaded with Coolmonkey CM40, the measured structure temperature fell from 51.1 °C to 39.7 °C, a drop of 11.4 °C.
The four measures assessed on the structure had different starting temperatures. The reductions apply to the specific points measured. The comparison shading fabric represents one sample. A fuller test protocol would be needed to compare the effects of weather and measurement timing.
| Measure | Before (°C) | After (°C) | Drop (°C) |
|---|---|---|---|
| Roof skylight with Coolmonkey CM40 | 51.1 | 39.7 | 11.4 |
| Comparison shading fabric | 47.1 | 43.8 | 3.3 |
| Latex thermal coating | 41.8 | 39.2 | 2.6 |
| External reflective film | 37.5 | 36.0 | 1.5 |
The comparison fabric is a sample of shading fabric from another manufacturer. Genuine Coolmonkey fabrics bear the Coolmonkey trademark.
Results apply to the specific points measured. The CM20 reading from a surface receiving sunlight is reported separately. Source A, pp. 2–6
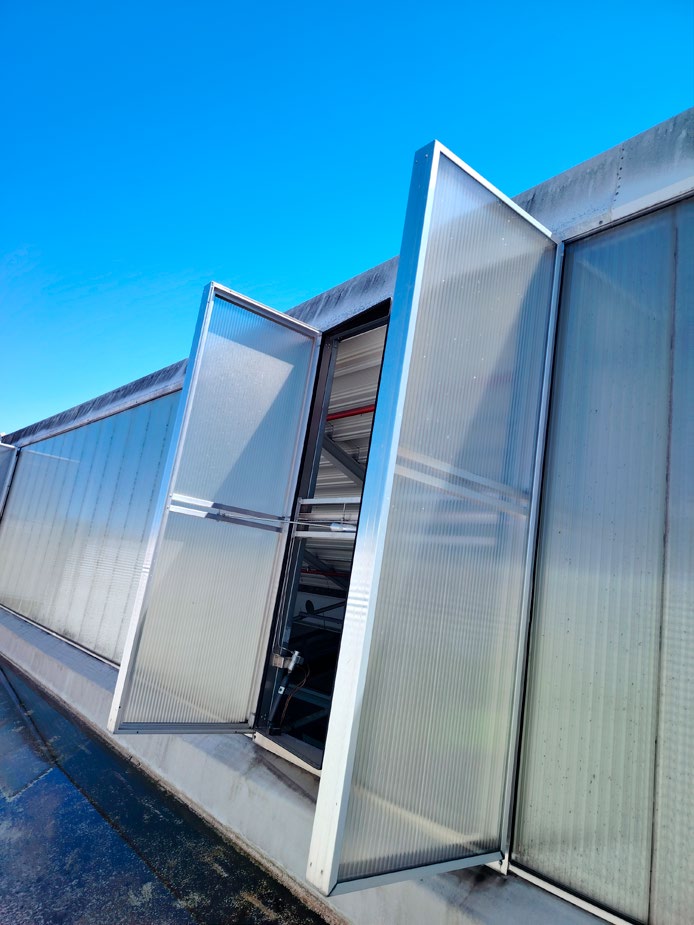
CM20 for opening skylight vents
For Coolmonkey CM20 shading used with opening skylight vents, the report records a temperature drop of 11.5 °C on a surface receiving sunlight. This result is shown separately because the measurement was taken on a different surface.
02
Summer test of white Coolmonkey CM40 shading fabric and glass
From 30 June to 16 August 2026, three DS18B20 sensors recorded temperatures at the white Coolmonkey CM40 shading fabric, at the glass and at a second test material. The second material was green film in the first phase and white nonwoven fabric in the second phase.
Across 12 selected sunny days, the mean of the daily maximum readings was 38.0 °C for the white Coolmonkey CM40 shading fabric and 51.0 °C for the glass, a difference of 13.0 °C. Source B, pp. 1–3 The system captured 31% of the test period (352 hours). During the recorded hours, temperatures reached at least 40 °C for 4.8 hours at the white Coolmonkey CM40 shading fabric and 36.1 hours at the glass. Source B, p. 4
Show daily readings
| Date | White Coolmonkey CM40 shading fabric (°C) | Glass (°C) | Second material | Second material (°C) |
|---|---|---|---|---|
| 46.5 | 59.0 | green film | 48.4 | |
| 41.9 | 55.4 | green film | 44.6 | |
| 38.8 | 52.0 | green film | 42.7 | |
| 35.1 | 48.8 | green film | 38.9 | |
| 34.0 | 44.4 | green film | 34.0 | |
| 36.7 | 54.5 | white nonwoven fabric | 49.3 | |
| Largest difference versus glass | 36.9 | 56.4 | white nonwoven fabric | 49.2 |
| 36.4 | 48.8 | white nonwoven fabric | 40.8 | |
| 36.9 | 48.7 | white nonwoven fabric | 41.2 | |
| 35.3 | 45.9 | white nonwoven fabric | 38.5 | |
| 41.4 | 54.0 | white nonwoven fabric | 45.3 | |
| 35.9 | 43.8 | white nonwoven fabric | 39.1 |
| Period | Selected days | White Coolmonkey CM40 shading fabric (°C) | Second material | Second material (°C) |
|---|---|---|---|---|
| 30 Jun to 7 Jul | 5 | 12.7 | green film | 10.2 |
| 13 Jul to 16 Aug | 7 | 13.2 | white nonwoven fabric | 7.0 |
The second test material changed during the test. Each row compares readings from its own period. Source B, p. 3
How the days were selected and what the result shows
The daily maximum comparison covers days when the glass sensor exceeded 40 °C and readings covered the period from 11:30 to 13:15 (Europe/Prague time). The system took readings about every 63 seconds. The readings describe specific sensor locations in a single setup that lacked cross-calibration and a separate ambient air temperature measurement. The green film and white nonwoven fabric were tested in different periods. Each is therefore compared with the glass readings from its own period.
The readings from 14 and 15 July were outliers following the replacement of the second test material. This should be taken into account when interpreting the results. Source B, p. 6
The summer measurements were carried out by the Faculty of Chemistry at Brno University of Technology, Purkyňova 464/118, 612 00 Brno, Czech Republic.
Sources
- Source A — Project report comparing five measures to reduce overheating, Hall M13 in Mladá Boleslav, pp. 2–6.
- Source B — Temperature Measurement Assessment, export and analysis dated 30 September 2026, pp. 1–6.
Is overheating a problem in your facility?
To estimate energy savings, we need details about your skylights, operations and cooling system. Tell us about your facility and we can suggest the next step.
Request a project-specific estimate